|
<< Click to Display Table of Contents >> Additional Features |
  
|
|
<< Click to Display Table of Contents >> Additional Features |
|
Progress Graph
GeneHunter can display a graph of the best fitness function versus generation number. The graph is a regular Microsoft Excel chart that allows easy customization. View this graph to see if the genetic algorithm is progressing in finding a solution.
To customize this chart (for example, to reset the number range), simply click on the chart with the right mouse button. Refer to the Excel help file or contact Microsoft for assistance in customizing Excel charts. This option may be turned on or off. The default setting is off.
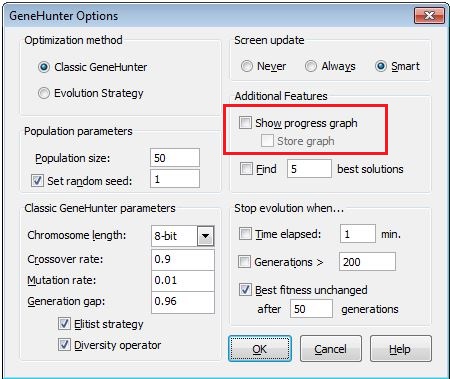
The show graph option displays a graph of the best fitness function versus generation number.
To display the graph:
Select GeneHunter from the Excel Tools Menu. The GeneHunter Dialog Screen is displayed. Click on the Options button. Click on the show graph checkbox. The graph will be displayed when you run GeneHunter.
To save the graph on the work sheet:
Click on the store graph checkbox on the GeneHunter Options screen.
Runner-Up Solutions
GeneHunter allows you to save "runner-up solutions" in addition to the best solution. In release 2.0, the user may specify how many (N) runner-up solutions should be kept after evolution is finished. These N best solutions are stored in a separate worksheet in the Excel workbook. This option can be turned on/off as needed. The default setting is off.
To create a worksheet of the best solutions, select GeneHunter from the Excel Tools Menu. The GeneHunter Main Dialog Screen is displayed in the worksheet.
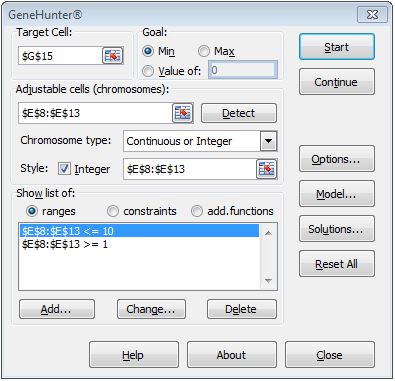
GeneHunter Main Dialog Screen
Next, select Options from the GeneHunter dialog box.
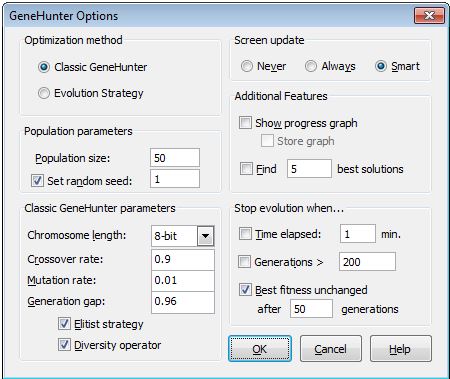
GeneHunter Options Dialog Box
On the Options dialog box, click on the checkbox beside the Find _ best solutions box and type the number of solutions you want to be displayed in the edit box.
Return to the GeneHunter dialog box and click on the Start button. When GeneHunter has finished finding a solution, click on the Solutions button in the GeneHunter dialog box. A list of the top N solutions is displayed.
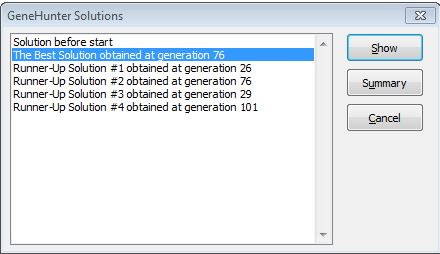
Solutions List Box
Click on a solution you want to view and click on the Show button. That solution is displayed in your original worksheet.
Click on the Summary button to create a new worksheet that displays the best N solutions. In addition to the value of the cell for the fitness function, a box is displayed which allows you to select additional worksheet cells that will be displayed in the Summary worksheet.
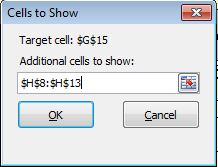
The Cells to Show box allows you to select additional cells to include in the new worksheet.
The summary worksheet will be given the name Summary (name of original worksheet). This new worksheet will allow you to compare the results for different solutions.