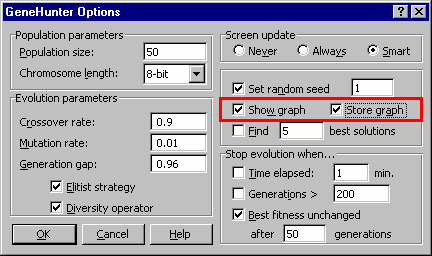
GeneHunter can display a graph of the best fitness function versus generation number. The graph is a regular Microsoft Excel chart that allows easy customization. View this graph to see if the genetic algorithm is progressing in finding a solution.
To customize this chart (for example, to reset the number range), simply click on the chart with the right mouse button. Refer to the Excel help file or contact Microsoft for assistance in customizing Excel charts. This option may be turned on or off. The default setting is off.
Figure 3.6 The show graph option displays a graph of the best fitness function versus generation number.
To display the graph: Select GeneHunter from the Excel Tools Menu. The GeneHunter Dialog Screen is displayed. Click on the Options button. Click on the show graph checkbox. The graph will be displayed when you run GeneHunter.
To save the graph on the work sheet: Click on the store graph checkbox on the GeneHunter Options screen. |